Architecture
Note
This documentation is drawn from the pytokio architecture paper presented at the 2018 Cray User Group. For a more detailed description, please consult that paper.
The Total Knowledge of I/O (TOKIO) framework connects data from component-level monitoring tools across the I/O subsystems of HPC systems. Rather than build a universal monitoring solution and deploy a scalable data store to retain all monitoring data, TOKIO connects to existing monitoring tools and databases, indexes these tools’ data, and presents the data from multiple connectors in a single, coherent view to downstream analysis tools and user interfaces.
To do this, pytokio is built upon the following design criteria:
- Use existing tools already in production.
- Leave data where it is.
- Make data as accessible as possible.
pytokio is comprised of four layers:
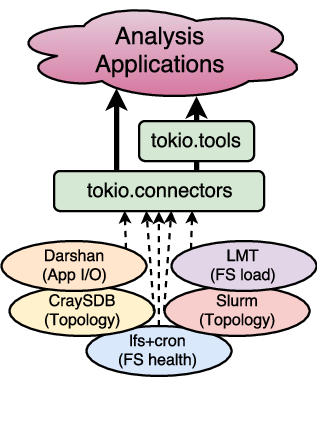
Overview of pytokio’s four layers.
Each layer is then composed of modules which are largely independent of each other to allow TOKIO to integrate with whatever selection of tools your HPC center has running in production.
Connectors
Connectors are independent, modular components that provide an interface between individual component-level tools you have installed in your HPC environment and the higher-level TOKIO layers. Each connector interacts with the native interface of a component-level tool and provides data from that tool in the form of a tool-independent interface.
Note
A complete list of implemented connectors can be found in the tokio.connectors documentation.
As a concrete example, consider the LMT component-level tool which exposes
Lustre file system workload data through a MySQL database. The LMT database
connector is responsible for establishing and destroying connections to the
MySQL database as well as tracking stateful entities such as database cursors.
It also encodes the schema of the LMT database tables, effectively abstracting
the specific workings of the LMT database from the information that the LMT tool
provides. In this sense, a user of the LMT database connector can use a more
semantically meaningful interface (e.g., tokio.connectors.lmtdb.LmtDb.get_mds_data()
to retrieve metadata server loads) without having to craft SQL queries or write
any boilerplate MySQL code.
At the same time, the LMT database connector does not modify the data retrieved from the LMT MySQL database before returning it. As such, using the LMT database connector still requires an understanding of the underlying LMT tool and the significance of the data it returns. This design decision restricts the role of connectors to being convenient interfaces into existing tools that eliminate the need to write glue code between component-level tools and higher-level analysis functions.
All connectors also provide serialization and deserialization methods for the
tools to which they connect. This allows the data from a component-level tool
to be stored for offline analysis, shared among collaborators, or cached for
rapid subsequent accesses. Continuing with the LMT connector example, the
data retrieved from the LMT MySQL database may be serialized to formats such
as SQLite. Conversely, the LMT connector is also able to load LMT data from
these alternative formats for use via the same downstream connector interface
(e.g., tokio.connectors.lmtdb.LmtDb.get_mds_data()). This dramatically
simplifies some tasks such as publishing analysis data that originated from a
restricted-access data source or testing new analysis code.
pytokio implements each connector as a Python class. Connectors which rely on
stateful connections, such as those which load data from databases, generally
wrap a variety of database interfaces and may or may not have caching interfaces.
Connectors which operate statelessly, such as those that load and parse discrete
log files, are generally derived from Python dictionaries or lists and
self-populate when initialized. Where appropriate, these connectors also have
methods to return different representations of themselves; for example, some
connectors provide a texttt{to_dataframe()} method (such as tokio.connectors.slurm.to_dataframe())
which returns the requested connector data as a pandas DataFrame.
Tools
TOKIO tools are implemented on top of connectors as a set of interfaces that are semantically closer to how analysis applications may wish to access component-level data. They typically serve two purposes:
- encapsulating site-specific information on how certain data sources are indexed or where they may be found
- providing higher-level abstractions atop one or more connectors to mask the complexities or nuances of the underlying data sources
pytokio factors out all of its site-specific knowledge of connectors into a single site-specific configuration file, site.json, as described in the Install Guide. This configuration file is composed of arbitrary JSON-encoded key-value pairs which are loaded whenever pytokio is imported, and the specific meaning of any given key is defined by whichever tool accesses it. Thus, this site-specific configuration data does not prescribe any specific schema or semantic on site-specific information, and it does not contain any implicit assumptions about which connectors or tools are available on a given system.
The other role of TOKIO tools are to combine site-specific knowledge and multiple connectors to provide a simpler set of interfaces that are semantically closer to a question that an I/O user or administrator may actually ask. Continuing with the Darshan tool example from the previous section, such a question may be, “How many GB/sec did job 2468187 achieve?” Answering this question involves several steps:
- Retrieve the start date for job id 2468187 from the system workload manager or a job accounting database
- Look in the Darshan repository for logs that match jobid=2468187 on that date
- Run the
darshan-parser --perftool on the matching Darshan log and retrieve the estimated maximum I/O performance
pytokio provides connectors and tools to accomplish each one of these tasks:
- The Slurm connector provides
tokio.connectors.slurm.Slurm.get_job_startend()which retrieves a job’s start and end times when given a Slurm job id - The Darshan tools provides
tokio.tools.darshan.find_darshanlogs()which returns a list of matching Darshan logs when given a job id and the date on which that job ran - The Darshan connector provides
tokio.connectors.darshan.Darshan.darshan_parser_perf()which retrieves I/O performance data from a single Darshan log
Because this is such a routine process when analyzing application I/O performance, the Darshan tools interface implements this entire sequence in a single, higher-level function called tokio.tools.darshan.load_darshanlogs().
This function, depicted below, effectively links two connectors (Slurm and
Darshan) and provides a single function to answer the question of “how well did
job #2468187 perform?”
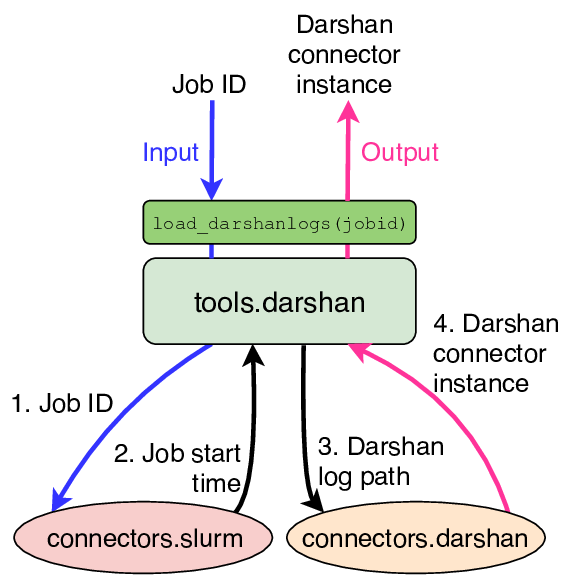
Darshan tools interface for converting a Slurm Job ID into
tokio.connectors.darshan.Darshan objects.
This simplifies the process of developing user-facing tools to analyze Darshan logs. Any analysis tool which uses application I/O performance and operates from job ids can replace hundreds of lines of boilerplate code with a single function call into the Darshan tool, and it alleviates users from having to understand the Darshan log repository directory structure to quickly find profiling data for their jobs.
TOKIO tools interfaces are also what facilitate portable, highly integrated
analyses and services for I/O performance analysis. In the aforementioned
examples, the Darshan tools interface assumes that Slurm is the system workload
manager and the preferred way to get start and end times for a job id.
However, there is also a more generic tokio.tools.jobinfo tool interface
which serves as a connector-agnostic interface that retrieves basic job metrics
(start and end times, node lists, etc) using a site-configurable, prioritized
list of connectors.
Consider the end-to-end example:
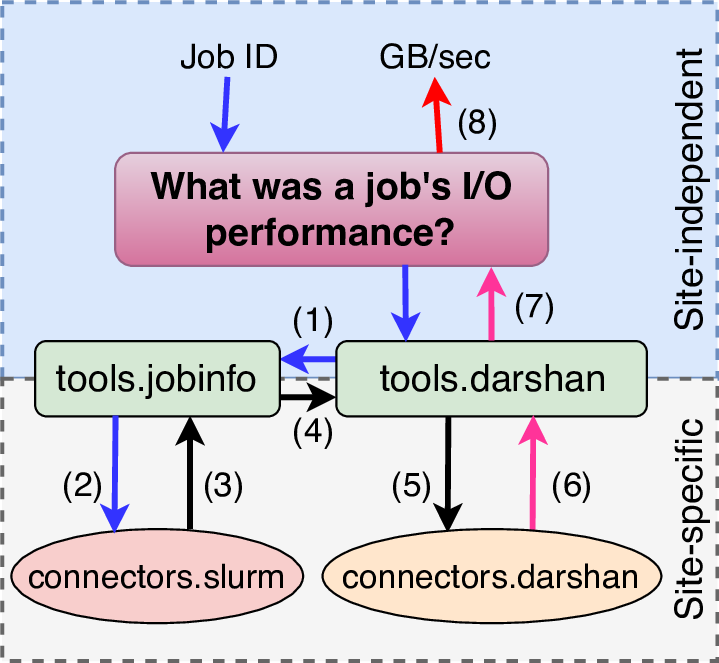
Example of how the tokio.tools.jobinfo tools interface enables
portability across different HPC sites.
In this case, an analysis application’s purpose is to answer the question,
“What was a job’s I/O performance?” To accomplish this, the analysis takes a job
id as its sole input and makes a single call into the pytokio Darshan tool’s
tokio.tools.darshan.load_darshanlogs() function. Then
- The Darshan tool first uses the jobinfo tool to convert the job id into a start/end time in a site-independent way.
- The jobinfo tool uses the site configuration to use the Slurm connector to convert the job id…
- …into a start/end time,
- which is passed back to the Darshan tool.
- The Darshan tool then uses the job start time to determine where the job’s Darshan log is located in the site-specific repository, and uses this log path…
- …to retrieve a connector interface into the log.
- The Darshan tool returns this connector interface to the analysis application,
- which extracts the relevant performance metric and returns it to the end user
Through this entire process, the analysis application’s only interface into pytokio was a single call into the Darshan tools interface. Beyond this, pytokio was responsible for determining both the proper mechanism to convert a job id into a job start time and the location of Darshan logs on the system. Thus, this analysis application is entirely free of site-specific knowledge and can be run at any HPC center to obtain I/O performance telemetry when given a job id. The only requirement is that pytokio is installed at the HPC center, and it is correctly configured to reflect that center’s site-specific configurations.
Analyses
TOKIO connectors and tools interfaces are simply mechanisms to access I/O telemetry from throughout an HPC center. Higher-level analysis applications are required to actually pytokio’s interfaces and deliver to meaningful insight to an end-user. That said, pytokio includes a number of example analysis applications and services that broadly fall into three categories.
- Command-line interfaces
- Statistical analysis tools
- Data and analysis services
Many of these tools are packaged separately from pytokio and simply call on pytokio as a dependency.